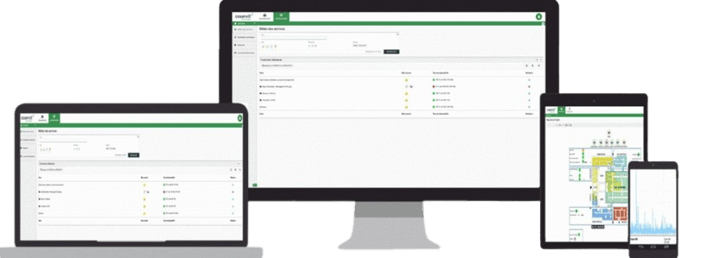
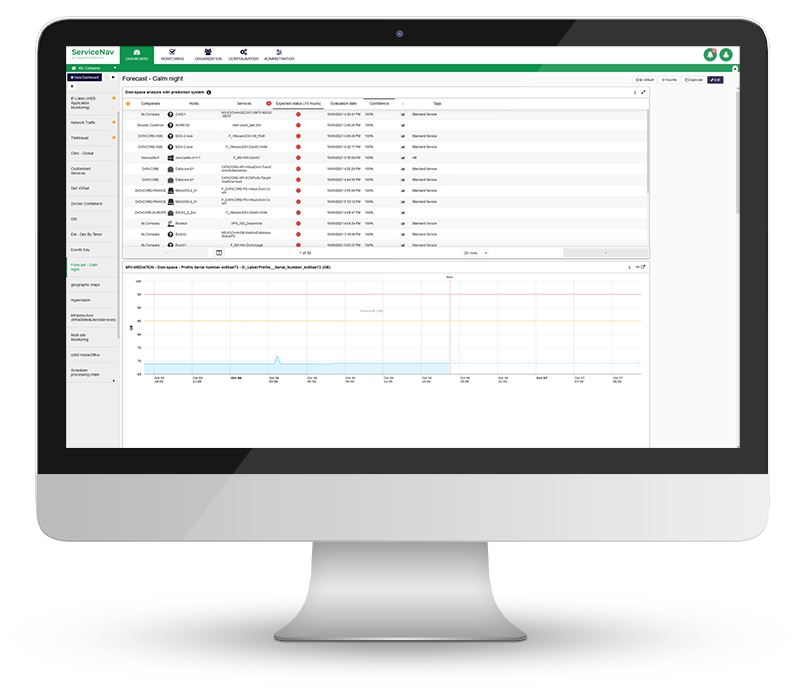
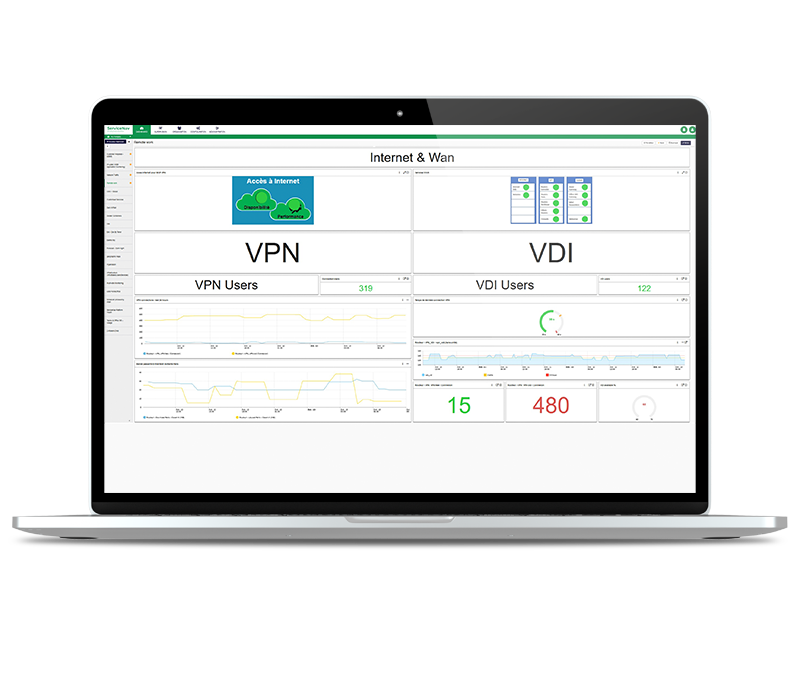
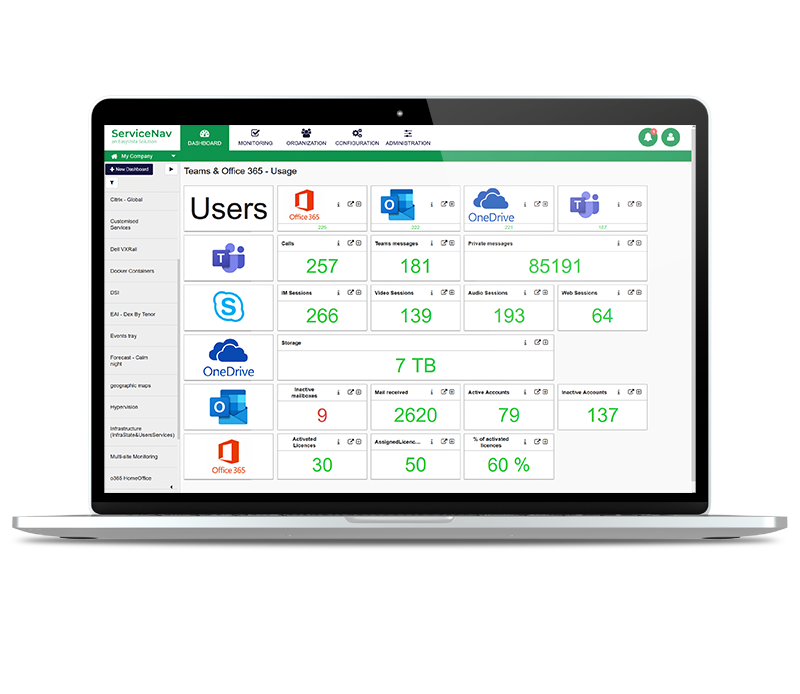
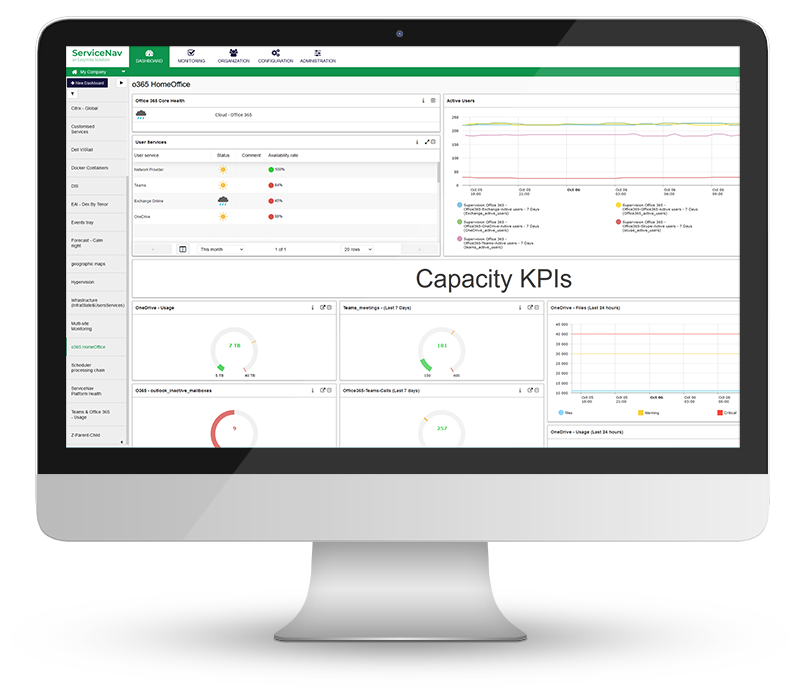
The modularity of Dataviz is based on the library of widgets and the high level of customization that this provides.
The library is enriched with each new version.
- List of statuses
- MAP
- Map
- Park monitoring (category)
- Park follow-up (family)
- Network analysis
- User Services
- Chart
- Gauge
- Text
- Image
List of statuses 
Data represented
Displaying a Status List, configured in the tab Configuration > Reporting of ServiceNav.
The Status List is a historical content template for ServiceNav, used in the previous generation of dashboards (carousel).
Features
Interactions with the list
It is possible to interact with items in the Status List :
- Simple sorting: click on header
- Sortable columns: all except "Labels".
- Multiple sorting: click + SHIFT
- Opening an equipment/service detail sheet: click on the name
- Launch an immediate check: click on the last analysis date
- Acknowledge/create a ticket: click on a non-OK status
- Displaying metric/ticket/maintenance details: click on the corresponding icon
- Show/hide columns
(only the "ticket" column is hidden by default)
Full Screen Mode
In RUN mode, the widget can be set to full screen, e.g. for a TV display.
The ESC key or the are used to exit this mode.
Configuration 
Configuring the contents of the Status List
The configuration of the filters and the information displayed in the Status List is done directly from the tab Configuration > Reporting of ServiceNav, by creating/modifying a dashboard using the "Status List" template.
Specific configuration for the "Widget" display
Filtering
Company filter area
It is possible to filter on the current company or daughter companies ()
Selecting the Status List
The list presents the List of statuses available on the company(ies) of the filter.
It is possible to search the list.
If the current dashboard is "public", this list displays only the List of statuses defined in terms of level of "public" visibility.
If the dashboard is "private", the List of statuses private are also offered.
It is possible to enter the edit mode of the List of statusesby clicking on the in the end.
The window displayed is the same as the one in the menu Configuration > Reporting
Added value / Use cases
Display on the same dashboard of several lists, in order to identify on the one hand the alerts on a perimeter of customers or critical equipment, and on the other hand those related to the internal infrastructure.
Multi-site detailed monitoring, unified on a single screen.
MAP
It is advised to use the MAPs with the Chrome, Firefox or Edge (Chromium based) browsers, as limitations related to Internet Explorer / Edge Legacy have been noticed when adding several MAPs on a Dashboard.
Data represented
Displaying a MAP, configured in the tab Configuration > Reporting of ServiceNav.
The MAP is a historical content model of ServiceNav, used in the previous generation of dashboards (carousel).
Features
Interactions in MAP
It is possible to interact with MAP elements, see documentation of the historical functionality : https://servicenav.coservit.com/en/documentations/configure-a-board-map/
Overview mode (
/
)
This display mode reduces the size of the widget to show only the statuses by category :
- Hosts
- Services
- User Services
A click on one of the lines exits the overview mode.
Full Screen Mode
In RUN mode, the widget can be set to full screen, e.g. for a TV display.
The ESC key or the are used to exit this mode.
Configuration 
Configuration of MAP content
The configuration of the filters and the information displayed in the MAP is done directly from the tab Configuration > Reporting of ServiceNav, creating/modifying a dashboard using the "MAP" model.
Related documentation : https://servicenav.coservit.com/en/documentations/configure-a-board-map/
Specific configuration for the "Widget" display
Filtering
Company filter area
It is possible to filter on the current company or daughter companies ()
MAP selection
The list shows the MAPs available on the filter company(ies).
It is possible to search the list.
If the current dashboard is "public", this list displays only the MAP defined in terms of level of "public" visibility.
If the dashboard is "private", the MAP private are also offered.
It is possible to enter the MAP editing mode, by clicking on the icon in the end.
The window displayed is the same as the one in the menu Configuration > Reporting
Added value / Use cases
Display on the same dashboard of an infrastructure diagram, and an application MAP, in order to monitor two aspects of the IS.
Multi-site detailed monitoring, unified on a single screen.
Map 
Data represented
Displaying a Geographic Map, configured in the tab Configuration > Reporting of ServiceNav.
The Geographic Map brings together the "Equipment (Map)" and "Service Weather (Map)" content models used in the previous generation of dashboards (carousel).
Features
Interactions with the Map
It is possible to interact with the elements of the Map :
- Zoom/Dezoom
- Refocus
- Click on a pin: displays the list of user equipment/services and enables the following actions
- Opening the equipment detail sheet
- Immediate check
- Create a ticket/exit
- Enable/disable sound notifications (in RUN mode)
Full Screen Mode
In RUN mode, the widget can be set to full screen, e.g. for a TV display.
The ESC key or the are used to exit this mode.
Configuration 
Configuring the contents of the Map
The configuration of the filters and the information displayed in the Map is done directly from the tab Configuration > Reporting of ServiceNav, by creating/modifying a dashboard using the "Equipment (Map)" or "Service Weather (Map)" template.
Specific configuration for the "Widget" display
Filtering
Company filter area
It is possible to filter on the current company or daughter companies ()
Map Selection
The list presents the Maps available on the company(ies) of the filter.
It is possible to search the list.
If the current dashboard is "public", this list displays only the Maps defined in terms of level of "public" visibility.
If the dashboard is "private", the Maps private are also offered.
It is possible to enter the edit mode of the Mapby clicking on the in the end.
The window displayed is the same as the one in the menu Configuration > Reporting
Added value / Use cases
Display on the same dashboard of several maps, as part of a low (equipment) and high (service weather) level multi-site supervision.
Park monitoring (category)
Data represented
Display of a cross table, representing equipment (online) and their services grouped by category (in column)
This widget corresponds to the "Asset tracking by service category" content model used in the previous generation of dashboards (carousel).
Features
Interactions with the table
It is possible to interact with the elements in the table :
- Click on company
- Click on equipment: several possible actions:
- Clicking on a pad (header or on a line): displays the list of equipment/services concerned and allows the following actions
- Opening the equipment/service detail sheet
- Immediate check
- Create a ticket/exit
Full Screen Mode
In RUN mode, the widget can be set to full screen, e.g. for a TV display.
The ESC key or the are used to exit this mode.
Configuration 
Content configuration
The configuration of the filters and the information displayed in the table is done directly from the tab Configuration > Reporting of ServiceNav, creating/modifying a dashboard using the "Fleet Tracking by Service Category" template.
Specific configuration for the "Widget" display
Filtering
Company filter area
It is possible to filter on the current company or daughter companies ()
Table selection
The list presents the Hosts and service categories available on the company(ies) of the filter.
It is possible to search the list.
If the current Dataviz dashboard is "public", this list displays only the "...". Fleet tracking by service category " defined in terms of "public" level of visibility.
If the Dataviz dashboard is "private", the " Fleet tracking by service category " private are also offered.
It is possible to enter the editing mode of the "...". Fleet tracking by service category "by clicking on the in the end.
The window displayed is the same as the one in the menu Configuration > Reporting
Added value / Use cases
Synthetic view of the state of an internal or customer perimeter, allowing to focus actions on a theme (database, disk, ...) or a perimeter of competence (application/system/infra).
Park follow-up (family)
Data represented
Display of a cross table, representing the companies/sites (online) and the statuses of their elements, grouped by family (in column): user services / equipment / unit services.
This widget corresponds to the content model "Tracking the park by family", used in the previous generation of dashboards (carousel).
The data displayed is the entire perimeter visible to the logged-in user, regardless of the company to which the dashboard belongs.
Features
Interactions with the table
It is possible to interact with the elements in the table :
- Click on company
- Click on equipment/unit service: opening of the technical operation on the company of attachment.
- Click on user service tablet: opening of the weather services
Full Screen Mode
In RUN mode, the widget can be set to full screen, e.g. for a TV display.
The ESC key or the are used to exit this mode.
Configuration 
Content configuration
The configuration of the filters and the information displayed in the table is done directly from the tab Configuration > Reporting of ServiceNav, creating/modifying a dashboard using the "Fleet Tracking by Family" model.
Specific configuration for the "Widget" display
Filtering
Company filter area
It is possible to filter on the current company or daughter companies ()
Table selection
The list presents the User services, hosts and service checks available on the company(ies) of the filter.
It is possible to search the list.
If the current Dataviz dashboard is "public", this list displays only the "...". Follow-up of the park by family " defined in terms of "public" level of visibility.
If the Dataviz dashboard is "private", the " Follow-up of the park by family " private are also offered.
It is possible to enter the editing mode of the "...". Follow-up of the park by family "by clicking on the icon at the end of the line.
The window displayed is the same as the one in the menu Configuration > Reporting
Added value / Use cases
Synthetic view of the state of a multi-site/multi-client perimeter, allowing a high level monitoring of the park and user services.
User Services 
Data represented
Display a table, representing user services belonging to the current company or one of its sites.
This widget presents information similar to that found in the menu Supevision > Service weather.
The data displayed is limited to the site to which the user belongs, and to his accounts and subordinates.
Features
Interactions with the table
It is possible to interact with the elements in the table :
- Click on the name of the user service: opening of the user service detail sheet
- Click on the icon representing the status: opening the dependency tree
- Mouse over the comment icon: comment display
- Change the pagination
- Change the availability calculation period (default: the current month)
- Display additional columns: Company, Label, Business Service
Full Screen Mode
In RUN mode, the widget can be set to full screen, e.g. for a TV display.
The ESC key or the are used to exit this mode.
Overview mode (
/
)
The Overview mode limits the display to the following information: Status / Name / Comment
Configuration 
Content configuration
Filtering by company
It is possible to filter on the current company code or account and subordinate companies ()
Selecting one or more User Services
The list presents the User Services available on the company(ies) of the filter.
It is possible to search the list.
Multi-selection is allowed.
Subscriptions to Cloud User Services defined at a higher level appear.
The box Allow the view scopeThe default checkbox can be unchecked to limit the widget display to its Summary view, in RUN mode.
Added value / Use cases
Integrating the User Services widget into your Dataviz dashboard allows you to stay on top of key metrics, even in application and service-rich environments.
In summary mode and shared via a Dashlink link, it allows you to communicate the status of key services to your key users and customers.
Chart 
Data represented
Raw data from the metrics of one or more controls (equipment or service), in the form of a time/value graph, identical to the Detail > Metrics sheet of an equipment/service.
Within the same dashboard, the "mono-metric" graph widgets are synchronized, so that the values displayed at a given moment can be easily compared.
Features
Analysis range filtering
Mono-metric configuration: the "last 3 days" range is proposed.
Multi-metric configuration: the range "last 3 days" is not proposed.
Opening the detail sheet of the equipment/service, on the " Metrics " tab 
Available in "single-metric" configuration
Context menu 
Show/Hide legends
The legends allow you to compare the values displayed. They are present by default.
Mono-metric configuration: the thresholds are represented
Multi-metric configuration: thresholds are not represented
It is possible to hide this area in order to maximize the space occupied by the graphic.
It is also possible to deactivate one or more objects making up the legend by clicking on them.
Multi-metric configuration: a click on the name of a metric opens the associated detail sheet
Configuration 
Filtering
Filter area that can be reduced () :
It is possible to filter on the current company or daughter companies ()
Item selection
Click
Enter the first few characters of the equipment or service name to select it.
Selecting the metric
Select the metric(s) to be displayed and validate the line.
Add metrics from other equipment/services if necessary
Validate the line, then the configuration window.
Inheritance rules
The data displayed is the raw data, over the selected filter period.
It is not possible to display more than 10 metrics on a single graph.
Added value / Use cases
This widget allows you to visualize the evolution over time of the value of a critical metric, such as the network consumption of an application (using Netflow), a simple ping, or the access time to an application website.
In multi-metric mode, it makes it easier to correlate different events, identify the root cause, and significantly reduce the resolution time. This approach is also appropriate for the supervision of "cluster" type infrastructures, where the simultaneous variation of the same metric, on several load-balancing devices, is an indicator to be monitored.
Gauge 
Data represented
Raw data from a control (equipment or service), in the form of a gauge (or a value in synthesis mode), with a minimum and maximum value, as well as thresholds.
Features
Opening the detail sheet of the equipment/service, on the " Metrics " tab
Overview mode (
/
)
This display mode reduces the size of the widget to show only its value. This can be useful when the gauge view is not desired, and you just want to monitor a metric at time t. The color of the value changes depending on the status.
Configuration 
Filtering
Filter area that can be reduced () :
It is possible to filter on the current company or daughter companies ( )
Item selection
Selecting the metric
This widget retrieves the alarm/critical thresholds if they are defined in the control associated with the metric.
In this case, these values are not modifiable at the widget level and will be grayed out.
If they are empty in the service/equipment configuration, thresholds can be freely specified.
The minimum and maximum value of the gauge can always be changed.
Only raw data is currently available in this widget.
Inheritance rules
The data displayed are the raw data, represented according to thresholds (orange and red bars on the gauge), on a gauge limited by minimum and maximum values.
The gauge and its value change colour when the threshold is exceeded.
Added value / Use cases
This widget allows you to view the current status of the value of a critical metric, and to quickly detect a change in status.
This can be relevant for monitoring disk space, detecting abnormal network consumption of an application (using Netflow), or access time to an application website.
Text 
Data represented
Free text entered by the user when creating or modifying the widget
Features
Displaying the entered text
Configuration 
Entering/changing text
Added value / Use cases
This simple widget can be used to add a comment or organize a complex dashboard, by category for example.
Image 
Data represented
External image URL, entered by the user when creating or modifying the widget
Features
Image display
Configuration 
Entering/changing the URL
Added value / Use cases
Display an application logo or associated with a client, to improve the clarity of a dashboard, or to highlight an advanced application supervision.
Network analysis 
Data represented
List of elements (talkers/protocols/connections) from the service models NetworkAnalysis-NetFlow-TOPList NetworkAnalysis-sFlow-TOPList.
> Service Template Configuration <<
Features
Opening the detail sheet of the equipment/service, on the tab "General". 
Overview mode (
/
)
This display mode switches the graph to List mode, for a more compact view of the presented items.
Configuration 
Filtering
It is possible to filter on the current company or daughter companies ( )
Item selection
Use case:
Detect bottlenecks on your network, thus maximizing the quality of service and associated SLAs.