Pre-requisites
Before you can monitor an Office 365 subscription, you need to meet the prerequisites described in the document : Prerequisites for Azure and Office365 monitoring.
What can we monitor?
The Office 365 web portal provides reports on the use of the various services available.
These reports are visible in the Office 365 Administration Center in the tab "Reports" -> "Usage".
Here are the services that provide reports on their use.
-
- Exchange
- Microsoft Team
- Office 365
- OneDrive
- SharePoint
- Skype Business
- Yammer
Complete API documentation : https://docs.microsoft.com/en-us/graph/api/resources/report?view=graph-rest-1.0.
How do we get those metrics back?
We have identified two types of data.
Global service usage data
In general, these are the metrics visible on the graphs.
Example for OneDrive :
Number of files per type of activity.
Example for Exchange :
Number of shares by type.
These two examples can be found in the Microsoft Graph API documentation:
- Number of files by type of activity : https://docs.microsoft.com/en-us/graph/api/reportroot-getonedriveactivityusercounts?view=graph-rest-1.0&tabs=c
- Number of shares by type : https://docs.microsoft.com/en-us/graph/api/reportroot-getemailactivitycounts?view=graph-rest-1.0&tabs=cs
The API response does contain the same information as the graphical user interface :
For OneDrive, the fields are: View or Edit, Synchronized, Shared Internally, Shared Externally.
Service usage data per user
These are the metrics found in the tables below the graphs.
They provide information on the use of the service for each user.
Example for OneDrive :
Number of files per type of activity for each user.
There is one line per user.
At the API level, on the Microsoft site for this example : https://docs.microsoft.com/en-us/graph/api/reportroot-getonedriveactivityuserdetail?view=graph-rest-1.0&tabs=cs
The API response contains the "User Principal Name" field, a sign that there will be one line per user.
You can find the fields present in the table visible on the web interface.
Which plugin to use?
Available since version 4.1, ServiceNav offers the following service template Office365-Generic to collect overall service usage data.
Monitoring of service usage data per user will be possible in a template available in a future release.
How to use the Office365-Generic template
As mentioned above, the Office365-Generic service template allows you to monitor only the overall usage of a service.
How to determine if a metric is available via this plugin or not?
There are two ways to do this:
- If the information is visible from the web portal on a graph, then it can be collected by the Office365-Generic plugin.
Example for the activation of Office365 licenses:
- Go to the Microsoft Graph API. Select the service and metric to be monitored.
For example, the number of activations of Office licences365 :
If there is no "User Principal Name" field in the response, then monitoring is possible with the Office365-Generic template.
Once we are sure that the metric is compatible with the plugin, we can proceed to check setup.
Configuring the check
The service is intended to be as generic as possible to retrieve as much information as possible. It will thus be necessary to configure it according to need.
In the following example, we will monitor the global storage used from the OneDrive service.
Here are the parameters to check this:
- "API request". : contains the request that the plugin will make to harvest the metric. This query fragment is present as a title on the documentation of each Office 365 metric:
- "Fields to process" CSV field returned by the API to be used. Each Office 365 service has its own CSV fields detailed in the documentation.
In our example, 5 fields are available:
It is possible to enter several fields separated by the pipe symbol " | " in case the plugin has to do a calculation. The values will be stored in variables $VAR1, $VAR2, $VAR3, etc...according to the order defined in the filed.
- Calculation" calculation to be carried out on the retrieved value(s). You can make a calculation to change the units.
In our example the value is in Bytes, it is transformed into Terabytes thanks to the calculation "$VAR1/1024**4".
Note: the operator "Power" is written : **.
It is possible to perform calculations between different values from the different fields of the "Fields to process" field. Example: $VAR2*100/$VAR1 - Performance data" performance data name for metric charts.
- "Text output". Text displayed in the ServiceNav web interface. The variable $RESULT contains the value retrieved by the plugin or the result of the calculation performed in the "Calculation" field.
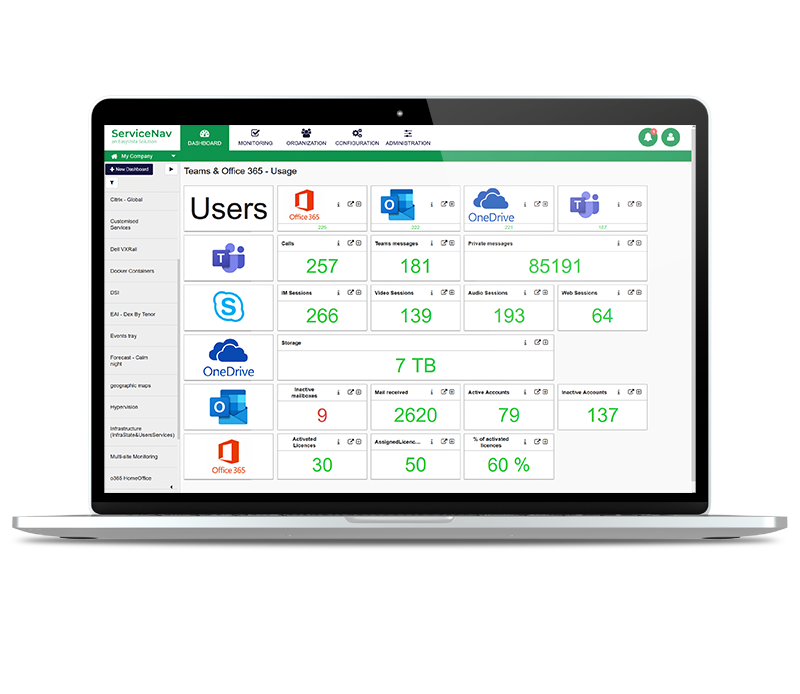
Result in ServiceNav :
Information display thanks to Dataviz.