Documentation

Manage your operation with the dashboards

On the page

Do you need help?

Introduction

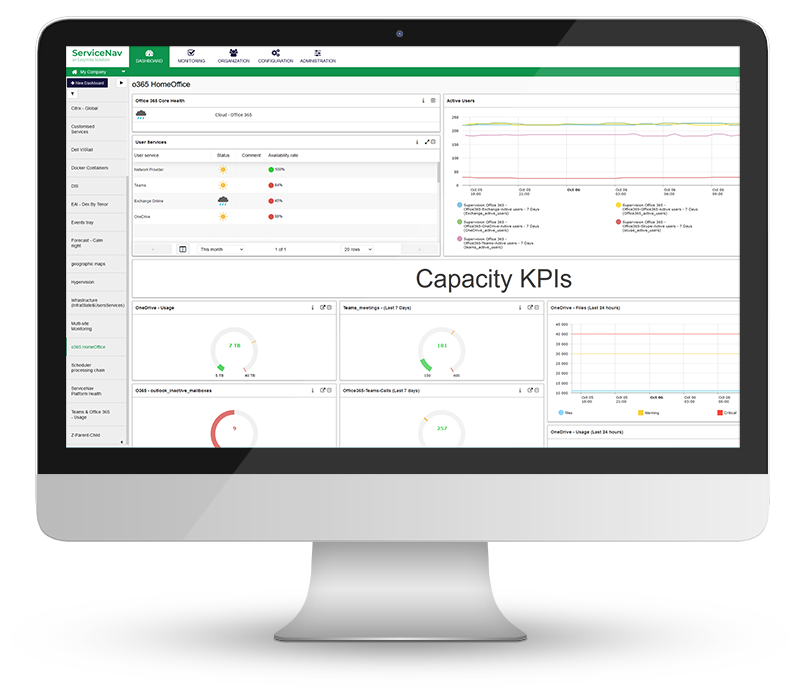
Dashboards are used in ServiceNav to visualize and act on the supervision data of a fleet of equipment. The dashboards therefore speed up the technical operation by allowing the operator to focus on his areas of interest.

This document explains how to configure and use the dashboards.

General principles

Models

The dashboards are visible in the Dashboard tab, which is the home page of the application.

The dashboards are built from dashboard templates. The following templates are available in the ServiceNav application:

  1. Tracking of the park by family
  2. Fleet tracking by service category
  3. Weather Services Map
  4. Equipment Map
  5. Mobile
  6. List of status

There is no limit to the number of configurable dashboards per user.

The reports displayed in the dashboards are taken from the application's real-time report database. They can be refreshed automatically or manually.

The model Tracking of the park by family allows you to view the status of a fleet by user, equipment or unit service status.

The model Fleet tracking by service category allows you to view the status of a fleet by equipment status or unit service.

The model List of status allows you to view the status of equipment and unit services in a park.

Configuration

The following items can be configured for a dashboard:

  • The title
  • Visibility: public or private
  • The possibility to include or exclude certain events by technical operation
  • The companies included in the dashboard, with the possibility to choose the companies by name, or by contract category (VIP) - for some dashboard templates
  • User services within the scope of the dashboard, selected by criticality - for some dashboard models
  • Equipment within the scope of the dashboard, selected by status, equipment criticality or equipment category - for some dashboard models
  • Unit services in the dashboard scope, selected by status, service criticality or service category - for some dashboard templates

Rights management

A dashboard is defined by a creator at account level. It is not inherited by the accounts subordinate to the company code.

The visibility rules are as follows:

  • All ServiceNav profiles that can access the Configuration > Reporting menu can set up a dashboard.
  • All users of a company have access to the "public" visibility dashboard definitions for that company. Private" visibility dashboards are only accessible to the creator users.
  • All ServiceNav profiles that can access the Dashboard tab can view the dashboard carousel and operate a selected dashboard in the carousel.
  • All users of a company have access to the "public" visibility dashboards of that company. Private" visibility dashboards are only accessible by the creator of the dashboard.

Setting up a dashboard

It is possible to set up a dashboard for a given company, or for a group of companies.

For a park

  • Positioning on the parent company (partner)
  • Navigate to Configuration > Reporting
  • Select the tab Customer base for internal use.

Configuration - Reporting - Dashboard - List - Customer base

  • This tab displays a list of all reports and dashboards with the following information:
    • Object type :
      • Dashboard : tachometer
      • Report : bar-chart
    • Visibility:
      • Private : Locked padlock
      • Public : Open padlock
    • Title of the report/dashboard.
    • Content model.
    • Creator and update date.
  • Create/modify the dashboard.

For a company

  • Position yourself in the company.
  • Navigate to Configuration > Reporting.

Configuration - Reporting - Dashboard - List - End customer

  • Create/modify the dashboard.

Create a dashboard

  • Click on Add.
  • Navigate to Reporting type :
    • Enter the title of the report.
    • Choose visibility.
    • Select the report type: Dashboard.
    • Select the dashboard template.
    • Select the events to be excluded from the dashboard:
      • Acknowledged events.
      • Unconfirmed events (status hard).
      • Events occurring on unitary equipment / services in maintenance.
    • Depending on the chosen dashboard model, other tabs appear to define the scope of the dashboard
      • The companies and sites concerned by this dashboard.
      • User services to be included in the dashboard.
      • Equipment to be included in the dashboard.
      • Unit services to be included in the dashboard.

Configuration - Reporting - Dashboard - Type

Company/Site tab:

Configuration - Reporting - Sites

The field View sites allows you to define if you want to display the name of the company's sites in the dashboard. If not, only the company name is displayed.

The field Selection type allows you to choose the way you want to select the companies/sites to be included in the dashboard:

  • By category VIP flag: allows you to include companies and sites according to their VIP flag.

Configuration - Reporting - Sites - Category

  • By company to manually select the companies and sites to be included in the dashboard.

Configuration - Reporting - Sites - Selection

Equipment tab

This tab allows you to define which equipment will be displayed in the dashboard.

Configuration - Reporting - Equipment

The SStatus allows you to filter the equipment to be included in the dashboard according to their status.

Configuration - Reporting - Equipment - Status

The field Selection type allows you to define which equipment is in the scope of the dashboard:

  • By category Equipment is selected according to its criticality, labels and categories
    • Selection of criticalities
      Configuration - Reporting - Equipment - Criticality
    • Label selection
      Configuration - Reporting - Equipment - Label
    • Category selection
      Configuration - Reporting - Equipment - Category
  • By equipment the equipment is selected manually by the dashboard creator

Configuration - Reporting - Equipment - Selection

Services tab

This tab allows you to define which unit services will be displayed in the dashboard.

Configuration - Reporting - Services

The field Status allows you to filter the unit services to be included in the dashboard according to their status.

Configuration - Reporting - Services - Status

The field Criticality allows you to filter the unit services to be included according to their criticality.

Configuration - Reporting - Services - Criticality

Finally, you must select the checkpoint categories to be included.

If several categories are selected, they can be moved from top to bottom to change the order in which the columns are displayed in the dashboard.

Configuration - Reporting - Services - Category

User Services Tab

This tab allows you to define which user services will be displayed in the dashboard.

Configuration - Reporting - SUT

The field Status allows you to filter the user services to be included in the dashboard according to their status.

Configuration - Reporting - SUT - Status

The field Selection type allows you to define which user services to include in the dashboard:

  • By Category The user services are selected according to their criticality.

Configuration - Reporting - SUT - Criticality

  • By user service User services are selected manually by the dashboard creator

Configuration - Reporting - SUT - Selection

Editing a dashboard

To edit an existing dashboard, click on the dashboard title in the Configuration > Reportingand then modify the fields as described in the previous chapter.

Delete a dashboard

To delete one or more dashboards :

  • Go to the menu Configuration > Reporting.
  • Select the dashboards to be deleted.
  • Click on the trash can icon.

Configuration - Reporting - Deletion

Using the dashboards

This section explains how to access the dashboard carousel and how to choose a dashboard element from the carousel. It details the different dashboard models and how to act on the supervised devices from a dashboard.

Dashboard carousel

The dashboards are visible in the menu Dashboard. This is also the home page after logging in.

When the user clicks on this menu for the first time after logging into ServiceNav, the first dashboard in the list of dashboards is displayed. The dashboards are sorted according to their title, in ascending alphabetical order.

When the user returns to this menu later, the dashboard displayed is the last one the user viewed.

The user can display a new dashboard by clicking on the button at the top right of the page: the carousel is displayed.

Dashboard - change

Dashboard - carousel

To select the previous or next dashboard, click on the arrows.

To select a dashboard directly, click on its number at the bottom left.

To display the selected panel, click on it in the carousel.

The buttons at the top left allow you to control the refreshment of the dashboard data:

  • manual refreshTo manually refresh the dashboard data
  • automatic refreshTo automatically refresh the dashboard data
  • stop refreshmentTo stop the automatic refresh of the dashboard

Dashboard: monitoring the fleet by family

This section describes the dashboard template Tracking of the park by family.

This dashboard shows the number of user services, equipment and unit services with their status for all the companies in the fleet.

Dashboard - park monitoring by family

Each line represents a company in the park and all its sites. The name of the company is displayed in the column Companies.

The User services displays the number of user departments with the specified status. This number consolidates the statuses for the company code and sites.

The Hosts displays the number of pieces of equipment with the specified status. This number consolidates the statuses for the company code and sites.

The Unitary services displays the number of user departments with the specified status. This number consolidates the statuses for the company code and sites.

The ranking rule places the companies/sites on top of the dashboard that the operator should focus on. The ranking is done from the most critical status to the least critical status, and from user service to unit service. For the same status, the ranking is in alphabetical order.

The statuses are ranked from most critical to least critical:

  • red CRITICAL status
  • yellow Status ALERT
  • grey Status UNKNOWN
  • blue Status INDETERMINATE
  • green Status OK

Dashboard: fleet tracking by service category

This dashboard presents the list of the equipment of the park defined in the configuration.

Each line of the dashboard represents a piece of equipment and indicates: the name of the equipment, the company/site, the status of the equipment and the unit services.

The ranking allows the operator to focus on problems in descending order of importance, with the most important problems presented at the top of the dashboard. The degree of importance is deduced from the status of the equipment or equipment services, and the duration of that status.

The equipment is therefore ranked from top to bottom according to the following criteria:

  • redCRITICAL statuses from oldest to newest.
  • orangeALERT statuses from oldest to newest.
  • greyThe UNKNOWN statutes from oldest to newest.
  • blueINDETERMINATE statuses from oldest to newest.
  • greenOK statuses from newest to oldest.

The first column indicates whether the company or site is under a VIP contract or not.

Clicking on the name of the company or site allows you to navigate to the Supervision > Technical operation menu by positioning yourself on the corresponding site or company.

If in the dashboard the company is displayed in a red frame, it means that all equipment (not just those shown in the dashboard filter) in the company are in a status other than OK.

Clicking on the equipment opens a menu that allows the following actions:

  • Perform remote control at the company or site network level, according to the means configured at the company/site level.
  • Plan an immediate check of the equipment
  • Go to the equipment detail sheet

Dashboard - fleet tracking by service category - equipment menu

To configure the remote control, navigate to Configuration > General > Remote access.

By clicking on a number in the dashboard, a window is displayed showing the name of the unit service(s) in the category, the duration of the state, the date/time of the last analysis, and the result of the last analysis. Services are ordered from top to bottom in the list by decreasing criticality and decreasing report duration. The objective is to encourage the treatment of the most critical and oldest status.

By clicking on the name of the service, the user displays the details of the service.

Dashboard - fleet tracking by service category - service details

The user can click on the status of the unit service to acknowledge the event, or acknowledge the event and create a ticket in the ticket management system.

Dashboard - fleet tracking by service category - acknowledgement

To perform an immediate check, click on the last analysis time.

Dashboard - fleet tracking by service category - update service

The numbers displayed in each column identify the number of events with the most critical status for the category in the column. The '+' symbol indicates that there are other events with a less critical status.

You may also be interested in

c 96718e3be7027cc4d1f5a405517f0d7d 1

ServiceNav Integration Overview - Artis.net

c 96718e3be7027cc4d1f5a405517f0d7d 1

ServiceNav - ServiceNow Integration Overview

en_GB

Our next events

Our upcoming webinars

Our Previous Webinars

Welcome to ServiceNav!

Do you need some help? More information about our products? Write to us!
We will never sell or share your personal data with third parties. You have taken note of our privacy policy.
We use cookies to ensure the best experience on our site. If you continue to use this site, we will assume that you are satisfied with it.

Reserve your place

We will never sell or share your personal data with third parties. You have taken note of our privacy policy.