Prerequisites
Before you can monitor an Office 365 subscription, it is necessary to set up the prerequisites described in the documentation : Requirements for Azure and Office365 monitoring.
What can be monitored?
The Office 365 web portal provides reports on the usage of the different services available.
These reports are visible in the Office 365 Administration Center in the "Reports" tab -> "Usage".
The following services provide reports on their usage.
-
- Exchange
- Teams
- Office 365
- OneDrive
- SharePoint
- Skype Business
- Yammer
Full API documentation: https://docs.microsoft.com/en-us/graph/api/resources/report?view=graph-rest-1.0.
How do I get these metrics?
We have identified two types of data.
Overall service usage data
In general, these are the metrics visible on the graphs.
Example on OneDrive:
Number of files by type of activity.
Example on Exchange:
Number of shares by type.
These two examples can be found in the Microsoft Graph API documentation:
- Number of files by type of activity : https://docs.microsoft.com/en-us/graph/api/reportroot-getonedriveactivityusercounts?view=graph-rest-1.0&tabs=c
- Number of shares per type : https://docs.microsoft.com/en-us/graph/api/reportroot-getemailactivitycounts?view=graph-rest-1.0&tabs=cs
The API response contains the same information as in the web interface graph.
For OneDrive, there are the fields: View or Edit, Synchronized, Shared internally, Shared externally.
Service usage data per user
These are the metrics in the tables below the charts.
They provide information on the use of the service for each user.
Example on OneDrive:
Number of files per activity type for each user.
There is one line per user.
At the API level, on the Microsoft site for this example: https://docs.microsoft.com/en-us/graph/api/reportroot-getonedriveactivityuserdetail?view=graph-rest-1.0&tabs=cs
The API response contains the "User Principal Name" field, indicating that there will be one line per user.
You can find the fields present in the table visible on the web interface.
Which plugin to use?
Available since version 4.1, ServiceNav offers the Office365-Generic to collect the aggregate usage data of a service.
The monitoring of service usage data per user will be possible in a future service template available in a future release.
How to use the Office365-Generic template
As mentioned above, the Office365-Generic service template allows you to monitor only the overall usage data of a service.
How can you determine if a metric is available for use by this plugin or not?
There are two ways to do this:
- If the information is visible from the web portal on a graph, then it can be collected by the Office365-Generic plugin.
Example for Office365 license activation: - Go to the Microsoft Graph API. Select the service and the metric to be monitored.
For example, the number of activations of Office licenses365 :
If there is no "User Principal Name" field in the response, then monitoring is possible with the Office365-Generic service template.
Once we are sure that the metric is compatible with the plugin, we can move on to setting up the service.
Configuring the service
First, it is necessary to create a "virtual" host that is not pingable to which the Office365 services will be deployed.
The service template is designed to be as generic as possible, permitting the retrieval of the broadest amount of information. Consequently it is necessary to configure it according to need.
In the following example, we will monitor the global storage used by the OneDrive service.
The configuration of the service is as follows:
- "API request" field. Query fragment: query that the plugin will use to collect the metric. This query fragment can be obtained from the title of each Office 365 metrics documentation:
- "Fields to be processed" field CSV field : CSV field returned by the API tu be used in the check. Each Office 365 service has its own CSV fields described in the documentation.
In our example, 5 header fields are available:
It is possible to specify several fields separated by the pipe symbol " | " in case the plugin has to make a calculation. The values will be stored in variables $VAR1, $VAR2, $VAR3, etc... based on the order defined in the parameter.
- "Calculation" field used to define a calculation to be performed using the returned value(s). It is possible to change the unit of the calculation result.
In our example, the value is in Bytes, it is transformed into Terabytes using the calculation " $VAR1/1024**4 ".
Note: the "Power" operator is written : **.
It is possible to perform calculations between different values from the different fields in the "Fields to be processed" parameter. Example: $VAR2*100/$VAR1 - "Performance data" field Name of the performance data metric for the graphs.
- "Text output" field Text displayed in the ServiceNav web interface. The $RESULT variable contains the value retrieved by the plugin or the result of the calculation performed in the "Calculation" parameter.
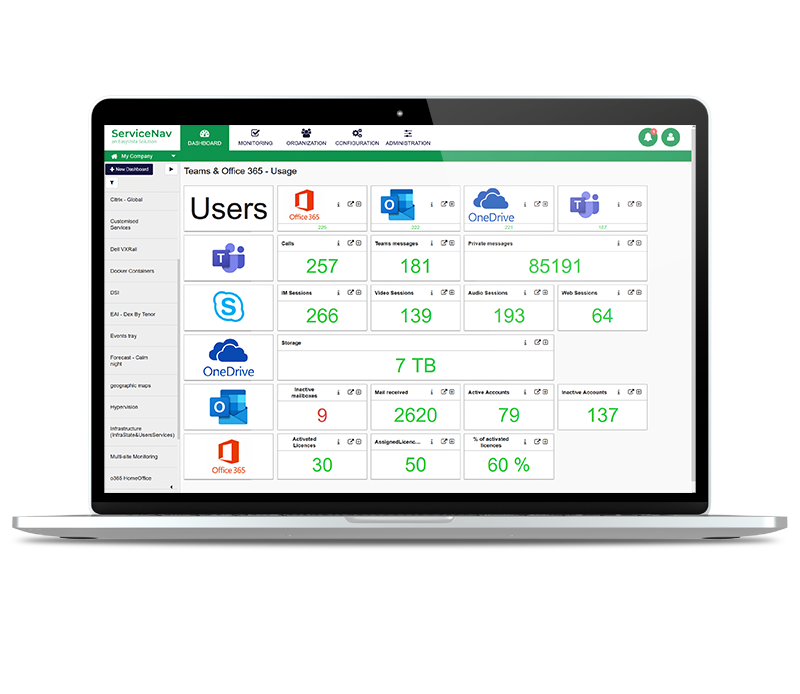
Result on ServiceNav :
Information display using Dataviz.