Using the service weather to represent the architecture of your Nutanix Cluster
Your Nutanix cluster closely integrates processing, storage, network and virtualization components.

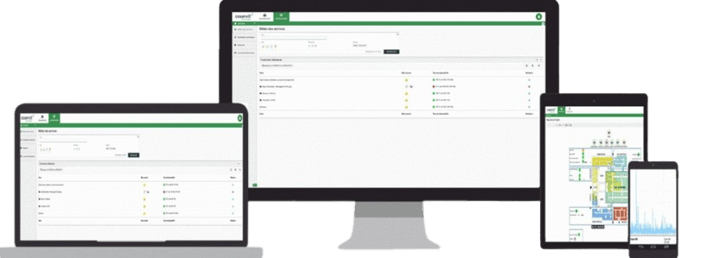
ServiceNav's "Service Weather" feature allows you to graphically model your Nutanix Cluster.
Try it free for 30 days
Through your weather services that you have configured by following our recommendationsIf you have a Nutanix Cluster, you will be able to schematize the different components of your Nutanix Cluster identically:

Why?
In the event of an alert on one of the components of your Nutanix Cluster, you will be able to mobilize the appropriate resources and skills to resolve the problem and return to normal as quickly as possible.
The interest of such a model is to be able, in case of an alert, to directly access the "root cause" or root cause of a degradation or blockage of the Nutanix Cluster. The graphical display of the service weather gives this view in 2 clicks.
The capture below clearly shows that this degradation is due to a Critical Alert from the Container 1 Usage 1 Pool.
You are able to mobilize the competent teams to intervene on your Nutanix Storage and increase your chances of resolving the problem for a quick return to normal.


Reproduce your weather from Nutanix services through our cartographic dashboard module by following the procedure below. following