Enhancement
Graphic Widget
Timeline synchronization
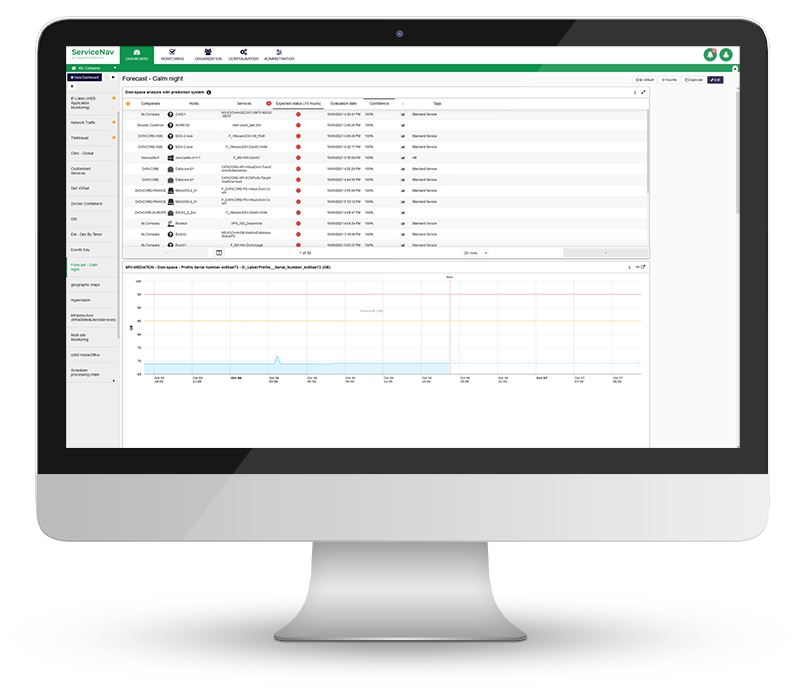
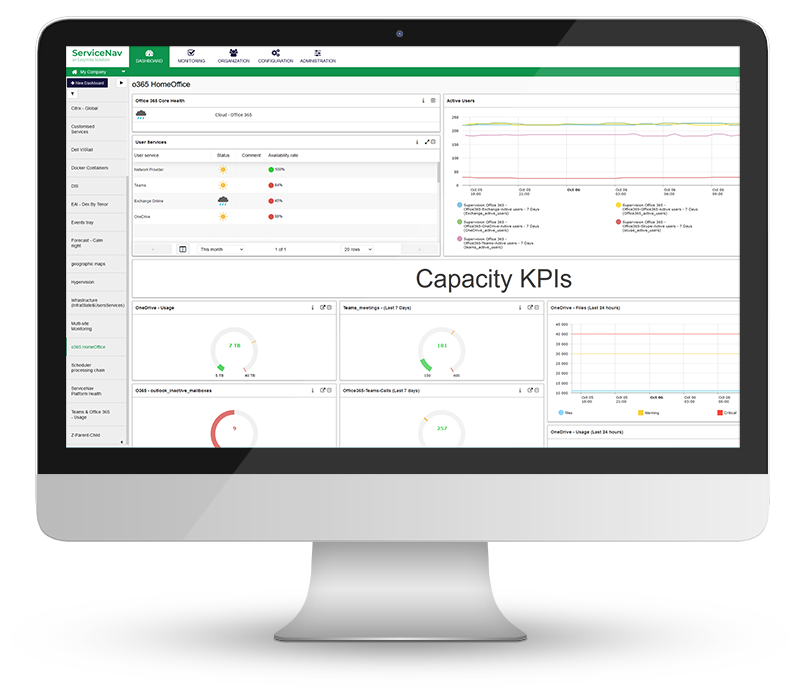
The timelines of graphics displayed on the same dashboard are now synchronized.
This feature makes it easier to compare different metrics at the same time.
Use cases : For troubleshooting purposes, the use of multiple synchronized graphs makes it easier to correlate different events, identify the root cause, and significantly reduce the resolution time.
Legends
The legend is now displayed in the Graphics widget.
It allows you to hide the threshold(s) represented by
Use cases : in a metric context with very high thresholds compared to the maximum values observed over the period, masking the thresholds allows you to adjust the vertical axis and represent the data more accurately, which will be less smoothed.
Service Templates
Our other release notes
ServiceNav 4.11
5 August 2020
ServiceNav 4.10
19 June 2020
ServiceNav 4.9
3 April 2020
ServiceNav 4.8
13 January 2020