In summary
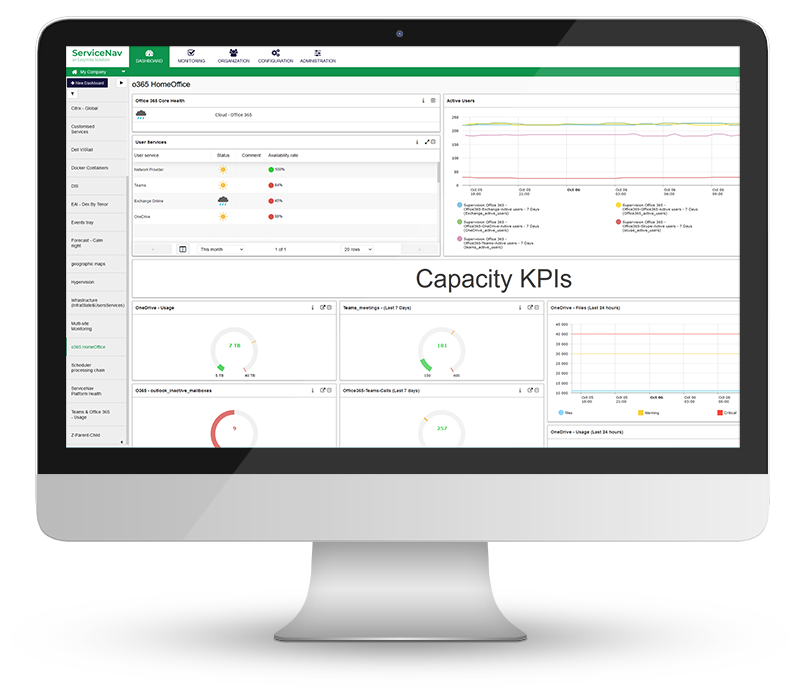
Major new feature for ServiceNav: metrics on the MAP Dashboard
Now it's time for functional supervision.
- E-commerce
- What is the average basket?
- How long does it take for my cart validation scenario to run?
- What is the number of orders per minute?
- IT Service
- What is the CPU/RAM load on my DBMS server during a backup operation?
- What is the percentage or value of bandwidth usage between the headquarters and remote sites?
- Access control
- How many people are currently in the building?
- Large-scale distribution
- What is the turnover per case?
- Hospitality/Medical
- What is the average or current temperature, per room, per floor?
You can now answer these questions with a simple glance at your MAP.
And all this in real time, according to the control interval.
The use cases are infinite, no doubt you will find yours.
The addition of the "metrics" element in the MAP Dashboard confirms ServiceNav's position as an IS management tool, at a functional/business level.
It is now possible to represent the metric returned by a control point (percentage, value) in its gross valuehis average or average peak hourdirectly on the MAP Dashboard.
We are excited about this feature, as we sincerely believe that it can bring you a lot of benefits, and expand the scope of what ServiceNav can monitor, as well as the associated uses.
Extended GDPR functionality
In this version, access RGPD functionalities to help you achieve compliance.
Once the RGPD message is filled in (see release note 3.17), you will have to take note of it via a pop-up, the next time you access the platform.
This is the guarantee that the information has been seen and taken into account, for the whole population using ServiceNav, including users who do not log out, and therefore do not have access to the message on the login page.
Once the pop-up is closed, it will never be displayed to the user again.
Service Templates
Our other releases notes
Our latest articles
Our latest webinar