


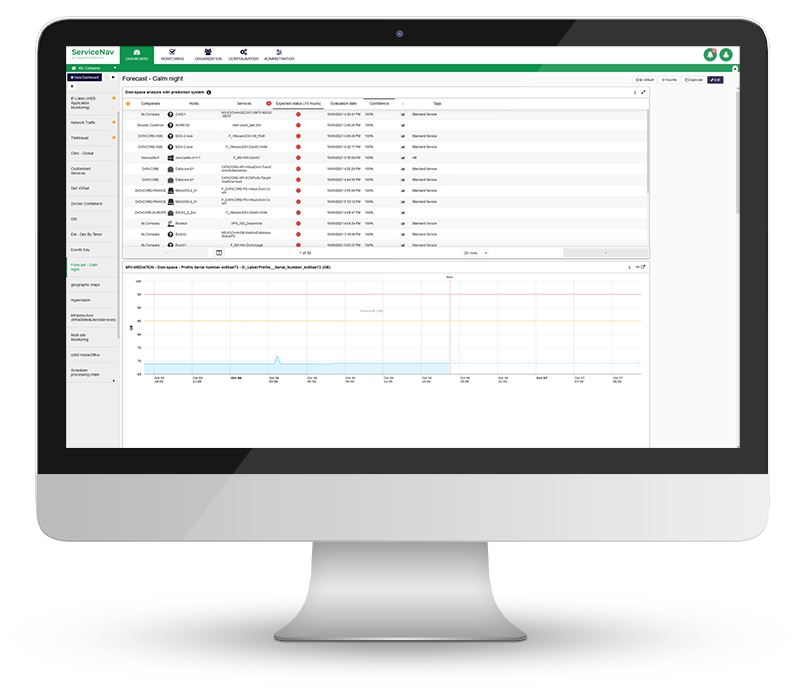
Increase Service Availability
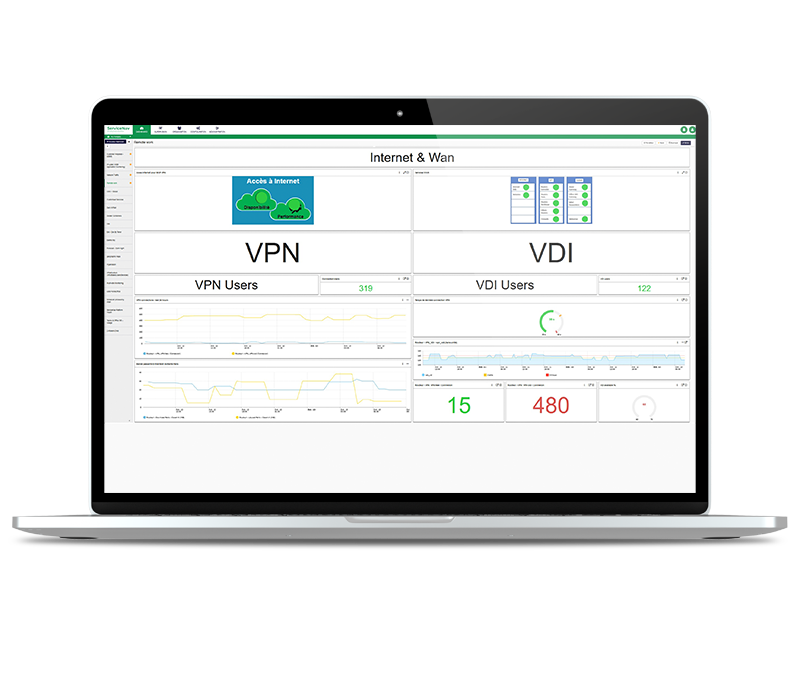
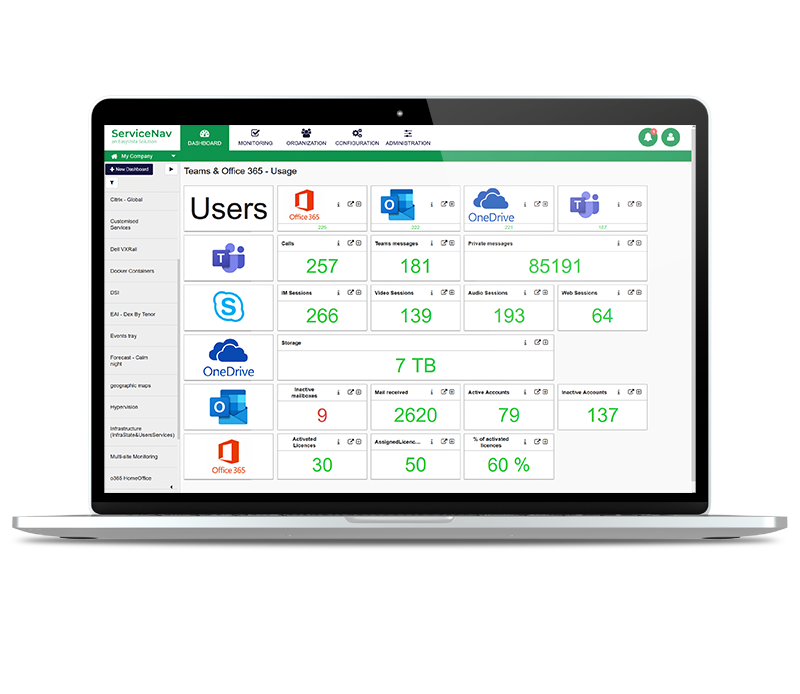
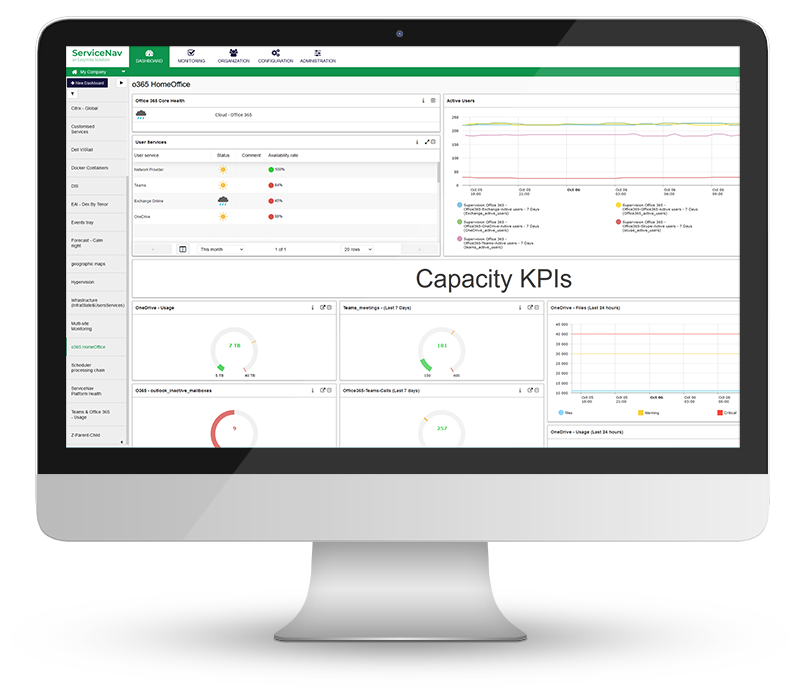
View real-time monitoring of your IT infrastructure, network, IoT, cloud and applications at lightning speed. Keep your managed assets up-to-date with no wasted time and no blind spots. Configure dynamic thresholds based on recommendations and reduce false positives by 30%. Never miss any alerts with multi-channel notifications and dashboards.